The visible brain of your business.
A glass box, not a black box.
Intelligence you can trace to source.
What B-Viz does
B-Viz is the brain of any business, built from the systems it already runs, on the architecture it already has. And it does the work: it briefs you before a meeting, tells you who to call and why, writes the proposal, prepares the board report, explains churn and shows what is working in the product. Every answer and every document is traceable to the records, and comes out in your own brand.
The demo runs it on BG-Demo, a fictional company: everything shown is the tool's real output on that data.
What it is used for
Each is at work in the demo now: open the page, or the example it made from one question.
Customer briefing
Before a meeting, one page on the account: its status and money, usage, open issues, the last calls and what was agreed, who matters on their side and who has joined or left, and the news about them.


Demo: BG-Demo, a fictional company
Calls to make
It spots the calls worth making, for a problem or an opportunity, and prepares each one with a briefing built from all the data and the actions agreed on earlier calls.


Demo: BG-Demo, a fictional company
Proposals
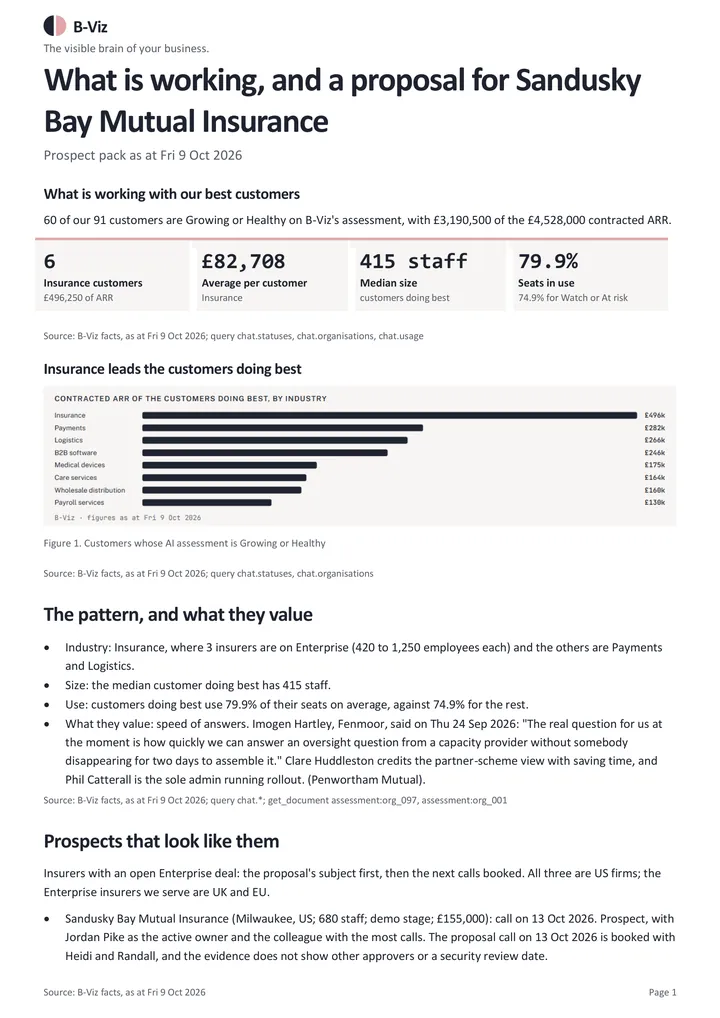
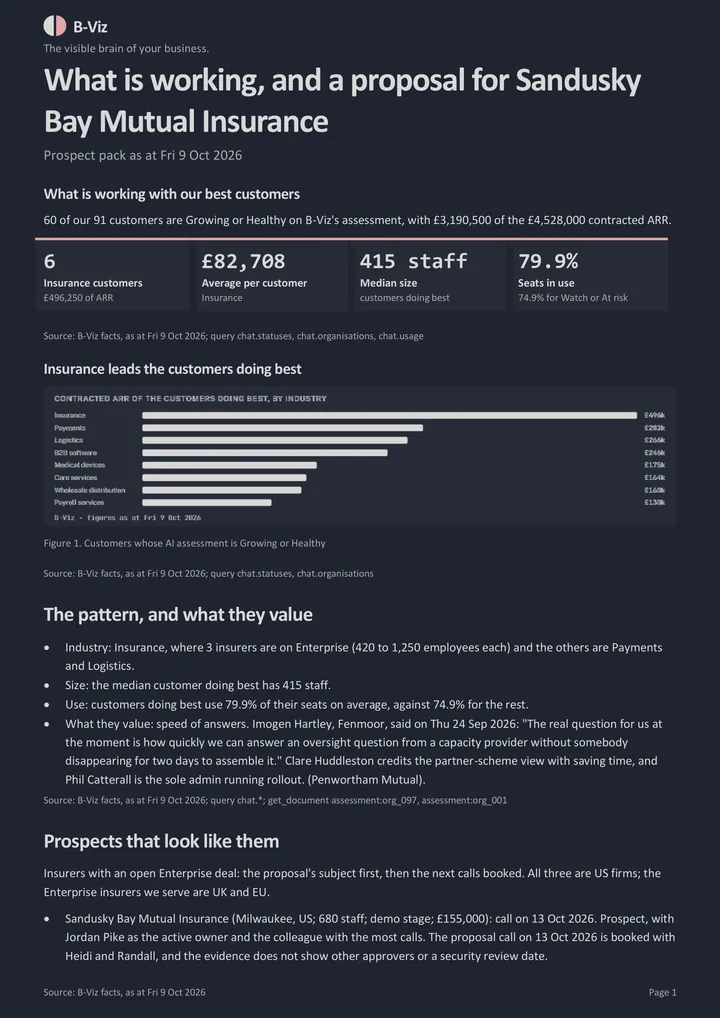
It sees what is working across your current customers, finds the prospects that look like them, and drafts the proposal.
Demo: BG-Demo, a fictional company
Board report
The quarter's numbers with the commentary written, as a deck: ARR, retention, pipeline, cash and the risks, each figure naming its source.
Demo: BG-Demo, a fictional company
Churn and retention
Why customers left, who looks like them now, and what to do about it before their renewal comes round.


Demo: BG-Demo, a fictional company
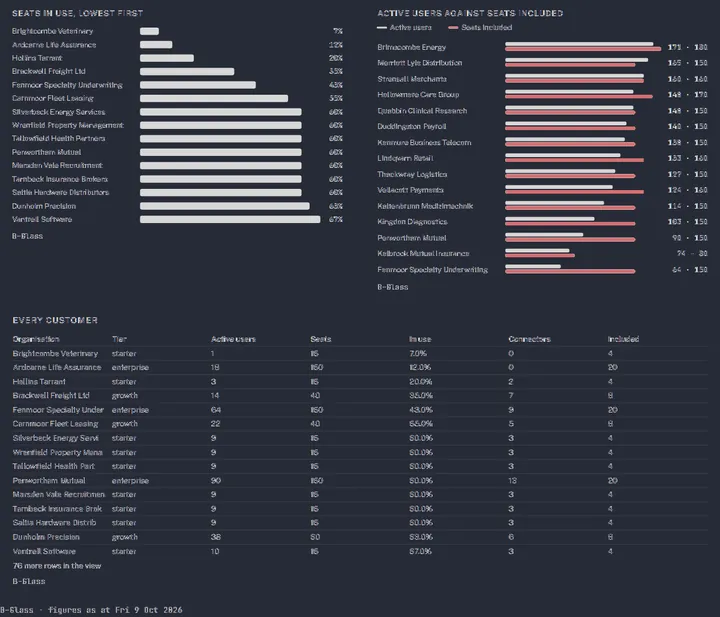
Product usage
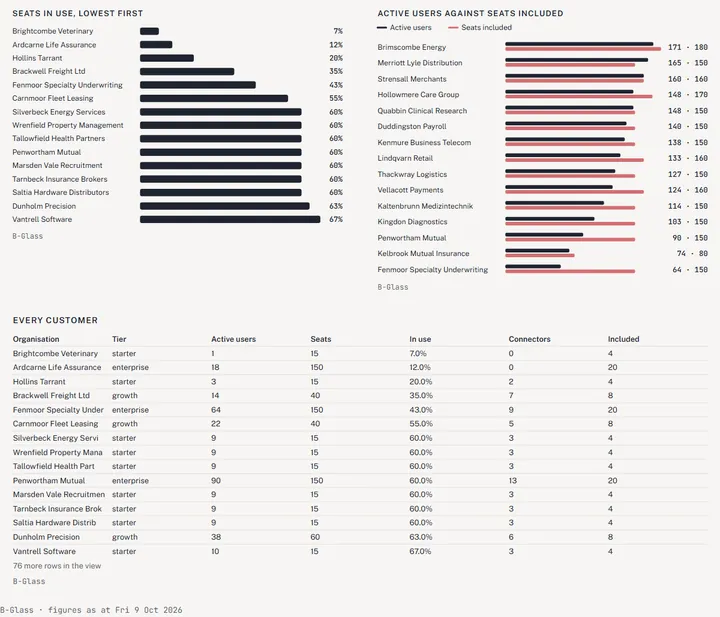
Who uses what they pay for, what is growing and where to act, by customer, product and month.
Demo: BG-Demo, a fictional company
How it works, and the proof
Figures are computed in code, never by the AI: each organisation's invoices, payments and deals are read once, in its finance read, and its platform usage in its usage read, both over those facts; the ledger feeds the figures, and the AI's summaries and commentary are written from them.
Layer by layer
One call, read by the AI


Demo: BG-Demo, a fictional company
A call's own page: what the AI found in it, the people on it and the transcript beside it.
The evidence trail


Demo: BG-Demo, a fictional company
One AI sentence picked, Brackwell Freight at risk, with every record it was built from and every page that shows it.
Click any node to move the trail to it; Back returns.
Evidence trail
Follow any figure or AI sentence back to the rows it came from.
Every card on the site ends with a small made from link. It opens the Evidence trail, the lineage view, focused on that card: the figure or sentence, then each layer below it (an organisation's assessment, the reads of its calls, emails and tickets, the facts) down to the raw rows in the source systems.
The document view
Every contract, order form, deck and note read and filed; each document's page shows what was found in it and where. More on the document store
As found in this document


Demo: BG-Demo, a fictional company
A signed order form's page: the dates, prices and commitments the AI found, each where it was found.
Open the document map to see the rest of the paper.
An organisation's document map


Demo: BG-Demo, a fictional company
Every contract, order form, deck and note for one organisation, laid out over time.
Click a document for what was found in it and the file it came from.
Platform usage


Demo: BG-Demo, a fictional company
Usage against what each customer pays for, by product and month, with the filter and slicer to cut it any way.
Pick a product or a customer and the charts follow.
Any business, the whole business
Built from what you run
B-Viz is built from the systems a business already runs, whatever it sells.
It joins the CRM, calls, email, support tickets and product usage with the finance ledger (the P&L, budget, cash, invoices and debtors), HR (staff, roles, joiners and leavers, time off), your document store and the news, for the board as much as for the account team.
BG-Demo sells a subscription, so the demo's measures are a subscription business's: ARR and retention beside gross margin, CAC, EBITDA and budget against actual. The measures follow your business.
The Profit and Loss


Demo: BG-Demo, a fictional company
Revenue against the costs in the ledger, by category, with the AI's commentary on EBITDA, margins and what is off target.
People


Demo: BG-Demo, a fictional company
Every member of staff by department, with the active count and who has left; time off and who reports to whom sit beside it.
Where it runs, and in whose brand
Where it runs
Implemented today on Snowflake, Azure, SharePoint and Cloudflare.
B-Viz works with whatever warehouse and stack you already have: it is built on top of them, so your data stays where it is.
In your brand
Ask on the site or in Claude, wherever you are working.
Reports, decks, proposals and RFP responses come out in your own templates and branding, every figure from the records. The demo shows B-Viz's own.
Decks, documents and charts, made by B-Viz
Each one made from a question, in the B-Viz brand, every figure from its own facts. All the examples
Board deck, Q3 2026
Demo: BG-Demo, a fictional company
A deck slide, made by B-Viz from the question: Build the board deck for the Q3 2026 board: ARR, retention, pipeline, cash, risks
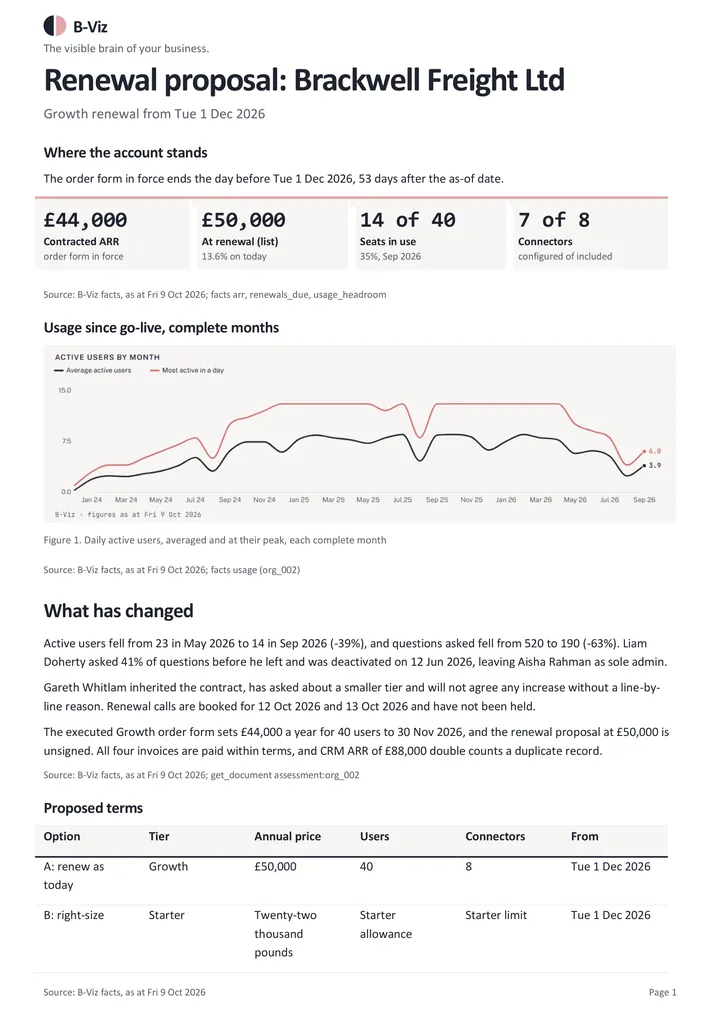
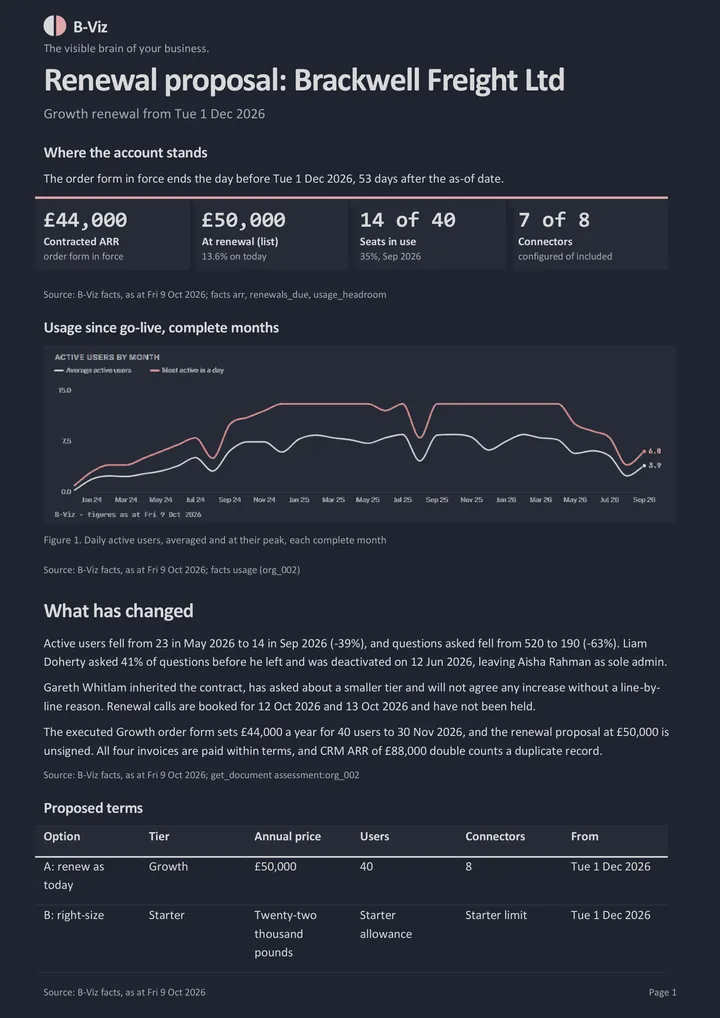
Renewal proposal
Demo: BG-Demo, a fictional company
A document page, made by B-Viz from the question: Write a renewal proposal for Brackwell Freight
Product usage and headroom
Demo: BG-Demo, a fictional company
A chart, made by B-Viz from the question: Chart seats in use across customers, lowest first, and tell me who is under-using what they pay for
Why B-Viz
Start small
You do not have to go all in: pick one data stream and see how B-Viz works on it.
Start with your calls, the CRM or email, see what B-Viz makes of it, then add the rest. The power is in having everything together; one stream is the taster.
Get in early
B-Viz is early stage and provided as a service, built and run for you on the stack you already have.
Engage us on a consulting basis now and you get the licence free for three years once it is available.